
At Superhuman, we're building the fastest email experience in the world.
This post describes several techniques to debug closed source libraries such as UIKit.
As we've pushed iOS to its limits, we've found some inscrutable runtime bugs. In order to solve these, we've had to dive into the deepest internals of UIKit.
Since UIKit is closed source, we can't place breakpoints or view the code. However, as we'll see, nothing in Objective-C is really private.
In this post, we'll cover:
- Reading private variables
- Swizzling to see property changes
- Watching memory to observe instance variable changes
Most of these examples are based on UIKit, but the techniques apply to any private Objective-C framework.
Reading Private Variables
Look at the Runtime Headers
The UIKit source code is not public, but we can read its runtime headers (.h files) to see method and variable names. The method names hint at their implementation, and importantly allow us to call them.
A few sites index the runtime headers. For example limneos.net, which can also search specific iOS versions.
If we are having trouble with a certain property or method in a class, we can search the header file for related methods.
Calling Private Methods
Once we find an interesting private method, it's useful to print the result from the debugger. For instance UITableView has a private method: -(id)_delegateActual. We can't run this in Swift, because Swift does not allow the calling of private methods:
(lldb) po tableView._delegateActual()

error: <EXPR>:3:1: error: value of type 'UITableView' has no member '_delegateActual'
However, in Objective-C, we can run arbitrary selectors on any object. We can get the pointer for the object, and then run an expression in Objective-C:
(lldb) po tableView
<UITableView: 0x7ff960053200; frame = (0 0; 375 812); clipsToBounds = YES; gestureRecognizers = <NSArray: 0x604000249e40>; layer = <CALayer: 0x60400003f880>; contentOffset: {0, 61}; contentSize: {375, 1320}; adjustedContentInset: {88, 0, 34, 0}>

(lldb) e -l objc -O -- [0x7ff960053200 _delegateActual]
<TableViewExperiments.ViewController: 0x7ff95ec1d7d0>
In this example:
eis short for expression which runs code and prints out the result-lsets the language to Objective-C-Ospecifies that this is an object, so the command should dereference the pointer before printing it out
If you're printing a primitive, simply omit -O.
(e -l is useful in other contexts too. e -l Swift allows you to run Swift code even when your stack frame is Objective-C.)
Reading Private Instance Variables
Let's say we find a private instance variable that we want to read. In modern Objective-C, properties are much more common than instance variables; we can simply use the above technique to run the private getter or setter methods backing the property. However, in UIKit, instance variables without properties are common and so are much harder to debug.
Recently, we were interested in the _firstResponderIndexPath property on UITableView. This property appears to be set whenever a cell in UITableView becomes the first responder. To read this variable, we can’t use the above trick because _firstResponderIndexPath is an instance variable:
(lldb) e -l objc -O -- [0x7ff960053200 _firstResponderIndexPath]

error: Execution was interrupted, reason: Attempted to dereference an invalid ObjC Object or send it an unrecognized selector.

The process has been returned to the state before expression evaluation.
However, nothing is really private in Objective-C. We can use the runtime to access any instance variable, even if it is private. First, we need to query the class for the Ivar object. Then we can query the instance for the value of this instance variable:
(lldb) po object_getIvar(tableView, class_getInstanceVariable(UITableView.self, "_firstResponderIndexPath")!)!

<NSIndexPath: 0xc000000000600016> {length = 2, path = 0–3}
Swizzling
It is useful to call and read private methods, but it is often more useful to see when these values change. Swizzling allows us to add breakpoints, examine the stack, and get clues on how features are implemented.
We want to know when a property on an object is changing. The easiest way to do this is to swizzle the setter. Swizzling is an Objective-C runtime technique to exchange method implementations. We replace the existing method with a new method, print the new value, and then call the old method. We effectively insert some debug code between the call site and the actual implementation of the method. The confusing part is this: in order to call the old method, we must call the new method's signature, since we've exchanged their names. It looks like this:
extension UIScrollView {
    class func swizzleZoomScale() {
        let originalMethod = class_getInstanceMethod(self,
            #selector(setter: minimumZoomScale))
        let swizzledMethod = class_getInstanceMethod(self,
            #selector(swizzle_setMinimumZoomScale(_:)))
        method_exchangeImplementations(originalMethod!,
            swizzledMethod!)
    }

    @objc dynamic func swizzle_setMinimumZoomScale(_ scale: CGFloat) {
        print("new value: \(scale)")

        // It looks like we're entering an infinite loop,
        // but exchangeImplementations has switched the method’s
        // names. So this method signature now maps to
        // the original minimumZoomScale implementation

        self.swizzle_setMinimumZoomScale(scale)
    }
}
In this case, we wanted to know when the minimum zoom scale changed. First, we call swizzleZoomScale() exactly once (for example, from UIApplicationDelegate). Then, we put a break point in the swizzle_setMinimumZoomScale. Whenever setMinimumZoomScale is called, the breakpoint will hit. We will then have a full stack trace to examine where and why the zoom scale changed.
Swizzling Private Methods
If we are trying to swizzle a private method, the above code won't work; it cannot find the selector we want to replace. There's an easy fix though. We just create an Objective-C category on the object and add it to the interface. We don't need to implement it; we just need to let the compiler know it exists.
@interface UITableView (Private)

- (void)_applePrivateMethod;

@end
With this, we'll be able to swizzle _applePrivateMethod.
Watching Memory
If we want to know when a property changes, we can simply swizzle the setter. However, many UIKit variables are not backed by properties but are instead set directly. Swizzling won't help in this case; we must watch memory directly.
We can listen to any variable with the watchpoint command in lldb:
(lldb) watchpoint set variable self.counterThis will hit a breakpoint whenever counter changes value. However, this doesn't work for private instance variables, since self.counter would not be accessible. To get around this, we can find the memory address of the instance variable.
Consider again the private instance variable _firstResponderIndexPath. This is set when a cell in UITableView becomes the first responder. First, we ensure the value is not nil, and then we print it out:
(lldb) po tableView
<UITableView: 0x7fefb482da00; frame = (0 0; 375 812); clipsToBounds = YES; gestureRecognizers = <NSArray: 0x604000249e40>; layer = <CALayer: 0x60400003f880>; contentOffset: {0, 61}; contentSize: {375, 1320}; adjustedContentInset: {88, 0, 34, 0}>

(lldb) po object_getIvar(tableView, class_getInstanceVariable(UITableView.self, "_firstResponderIndexPath")!)!

<NSIndexPath: 0xc000000000400016> {length = 2, path = 0 - 3}
This is useful, but it's not the memory we want to watch. To find the correct address, we need to understand how Objective-C puts classes on the heap. When we have a pointer to an object, that memory points to the start of a blob of memory with information on that instance. The first word contains the isa pointer, and after that are the instance variables of the class (see more in Apple's documentation). It looks like this:
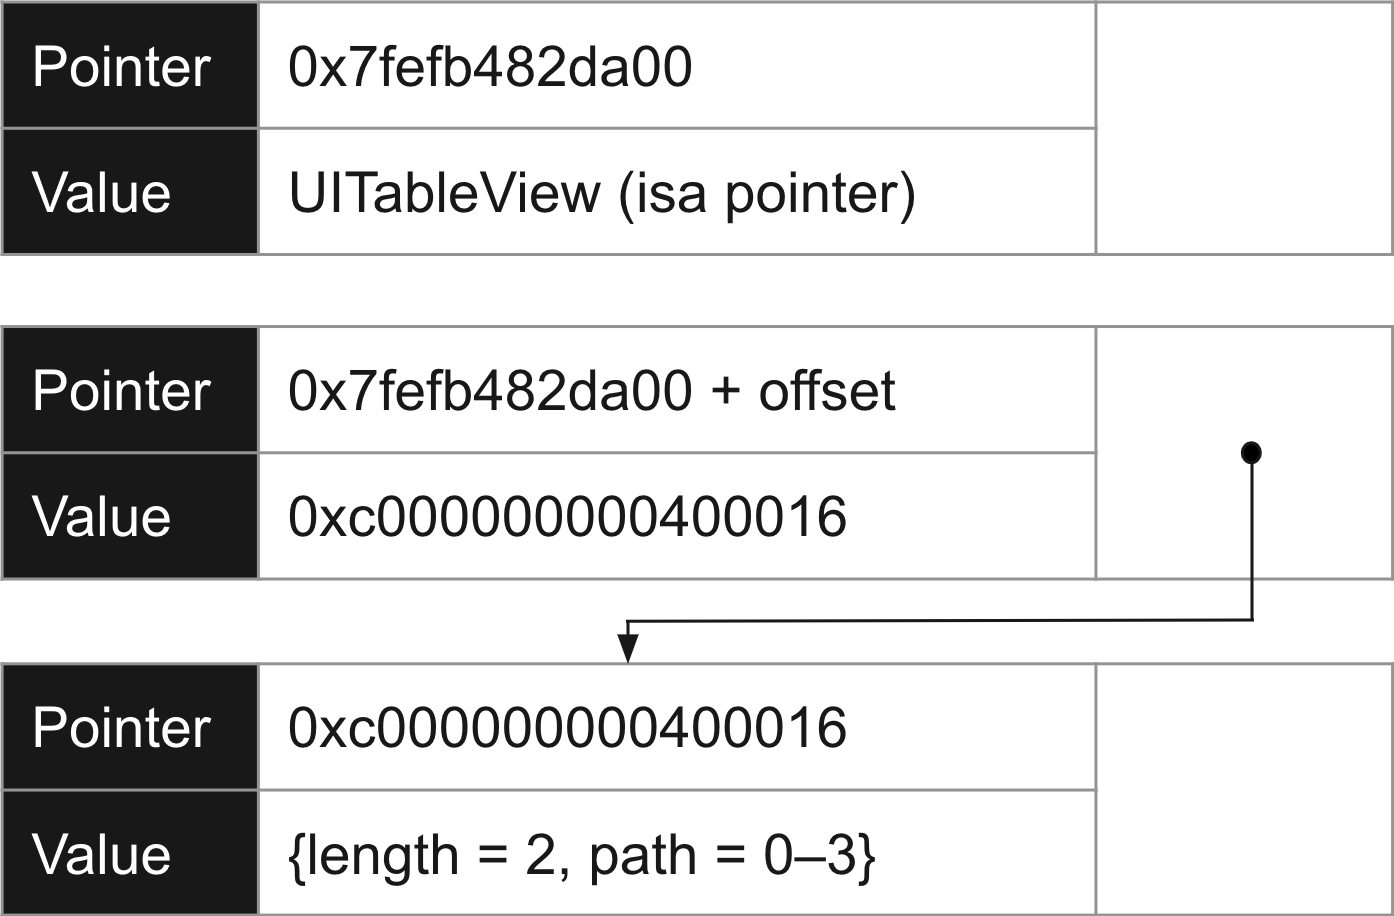
At some offset from the UITableView pointer is the memory representing _firstResponderIndexPath. Its value is the pointer to the IndexPath. When _firstResponderIndexPath changes, it will look like this:
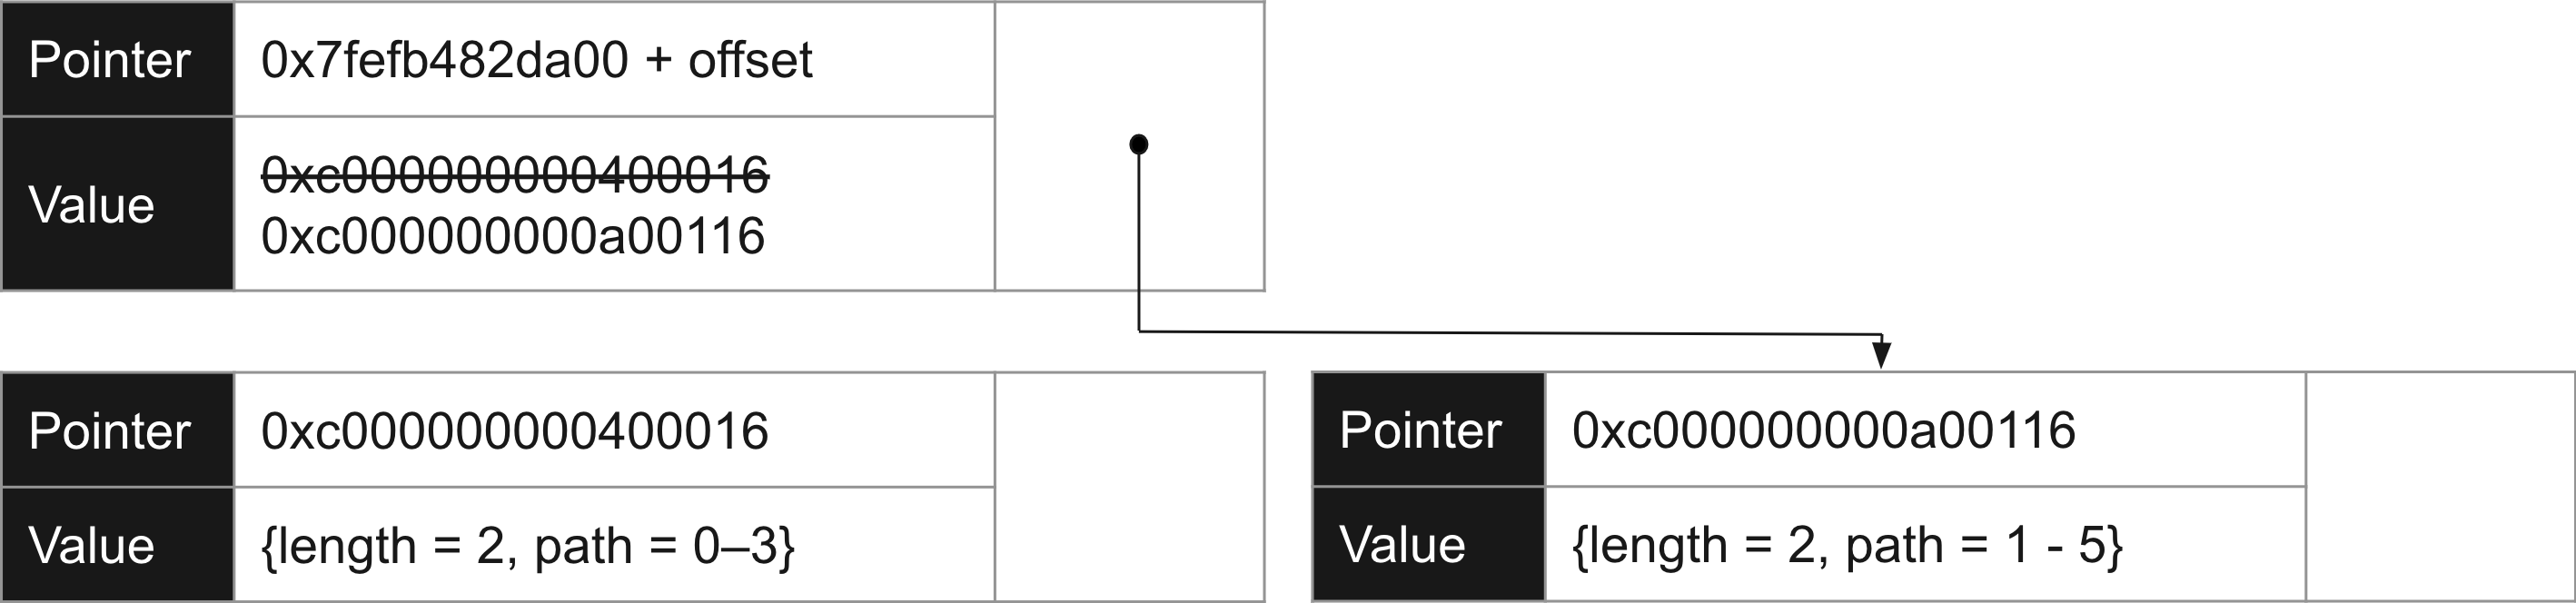
The memory at 0xc0000000000400016 won't change since it's an immutable object; there's no point watching that. Instead, we want to watch the memory at a specific offset from our UITableView pointer. This will always be the same offset, but we need to find it. Let's look at a memory dump around this pointer.
To view memory in Xcode, go to Debug → Debug Workflow → View Memory. Set the address to the pointer for the UITableView (in this case 0x7fefb482da00) and set the number of bytes to 4096. Now, we need to search for the value: 0xc0000000000400016. Using Cmd+F, we can see it highlighted in the middle of the dump:
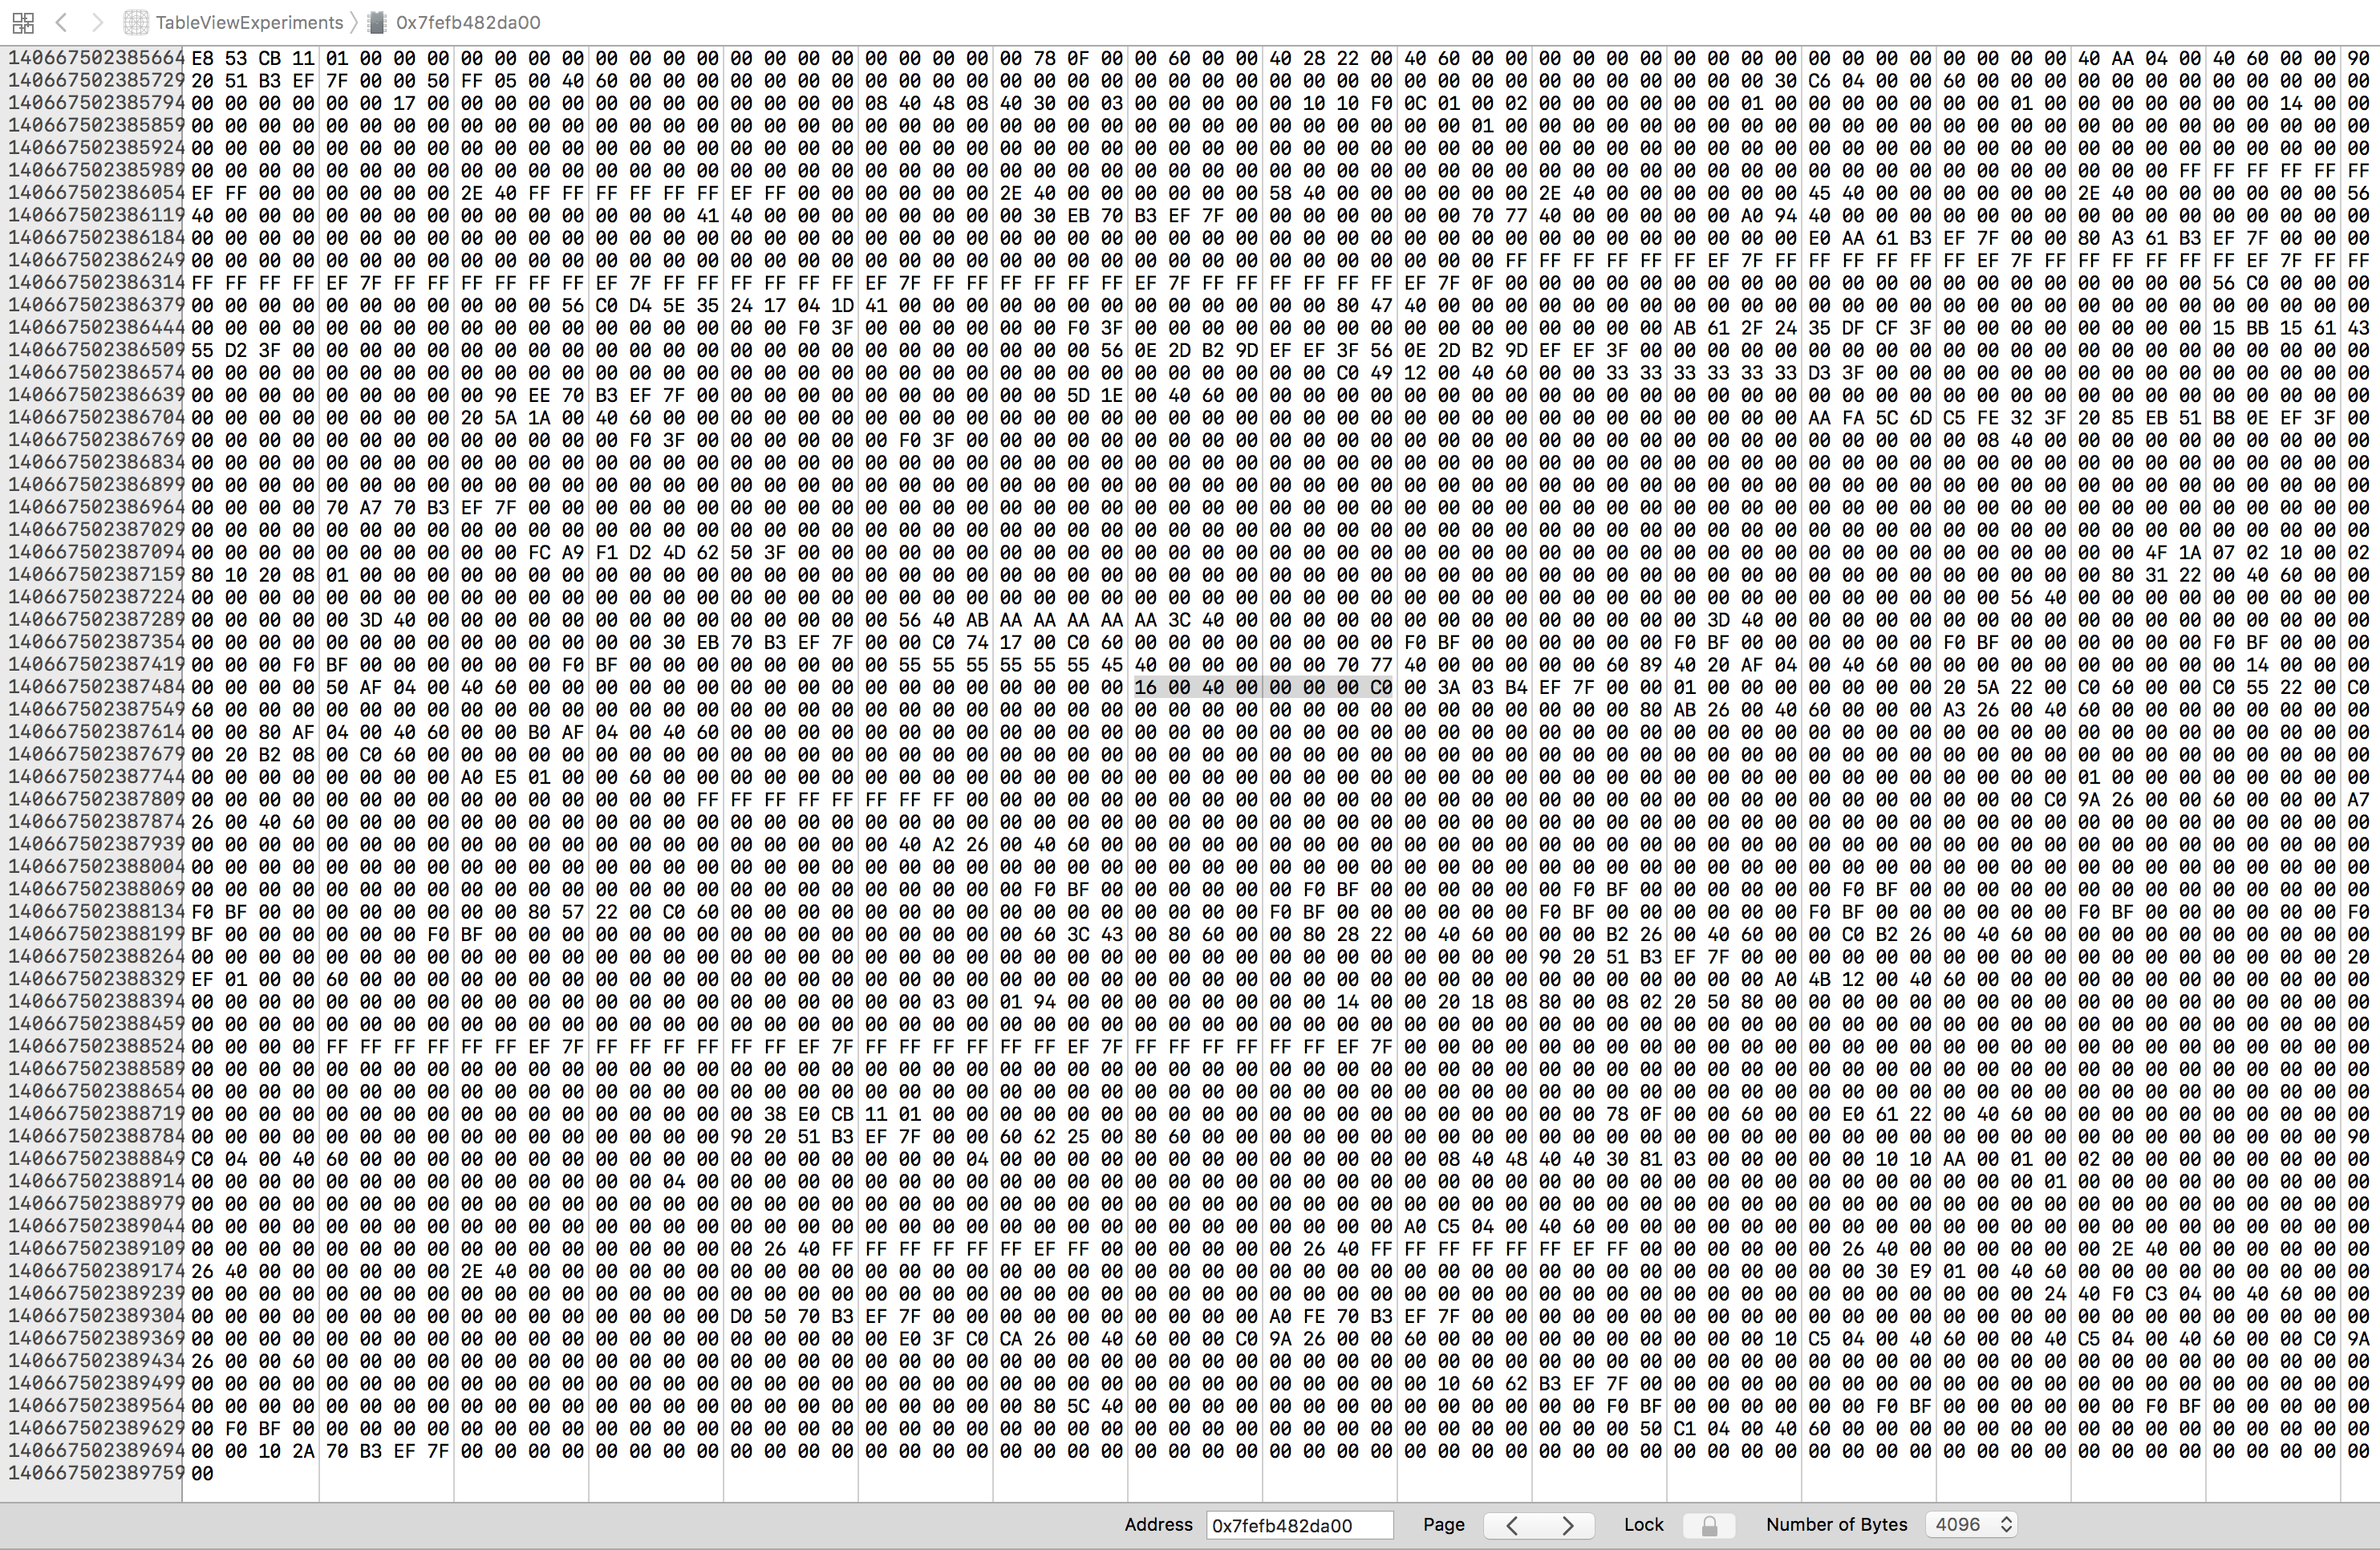
Notice that memory is laid out backwards in this view, so the value reads 16 00 40 00 00 00 00 C0. Using the memory location values on the left, we can see that this value is at address140667502387512 (0x7fefb482e138).
Let's try watching this address. (Note: this command doesn't work if you're in a Swift frame. To make it work, change your stack frame or use the pause button.)
(lldb) watchpoint set expression -- (void*)0x7fefb482e138
Watchpoint created: Watchpoint 1: addr = 0x7fefb482e138 size = 8 state = enabled type = w

new value: 0xc000000000400016
In the app, let's do something which we think will change this value. In this case, we set a different cell to be first responder. As soon as we do this, the breakpoint hits and we can see a backtrace. Often the breakpoint will hit twice: once when the value is set to nil, and again when the new value is set.
Finding the exact offset can be difficult, but we need only do it once. The instance variable is always at a constant offset. In this case, the table view was at 0x7fefb482da00 and the instance variable was at 0x7fefb482e138. The offset here is 1,848. We can now take any UITableView pointer and add 1,848 to get the pointer for the instance variable _firstResponderIndexPath.
(lldb) po tableView
<UITableView: 0x7ffd0d027800; frame = (0 0; 375 812); clipsToBounds = YES; gestureRecognizers = <NSArray: 0x600000053e60>; layer = <CALayer: 0x60000002f800>; contentOffset: {0, 93}; contentSize: {375, 1320}; adjustedContentInset: {88, 0, 34, 0}>

(lldb) po 0x7ffd0d027800 + 1848
140724821720888

(lldb) watch set expression -- (void *)140724821720888
Watchpoint created: Watchpoint 1: addr = 0x7ffd0d027f38 size = 8 state = enabled type = w

new value: 0x0000000000000000
Conclusion
Every ambitious project will encounter critical bugs in runtimes and frameworks. Sometimes, as with UIKit, those libraries will be private and closed source. Normally, this would be game over.
However, by reading private variables, swizzling property changes, and watching the right parts of memory, we can almost always find workarounds. We've successfully used these techniques to track down some otherwise showstopper bugs!
— Peter Livesey, Lead Engineer, Superhuman
At Superhuman we're rebuilding the email experience for web & mobile. Think vim / Sublime for email: blazingly fast and visually gorgeous.
Thank you to Akram, Marin, Colin, and Cezary for reviewing drafts of this post.
If you love solving interesting problems in elegant ways — join us! Learn more or email us.