At Superhuman, we're building the fastest email experience in the world. Get through your inbox twice as fast as before, and sustain inbox zero!
As the saying goes: "If you can't measure it, you can't improve it."
We therefore spend a lot of time measuring speed. And as it turns out, performance metrics are surprisingly challenging to get right.
On the one hand, it is hard to design metrics that accurately represent the user experience. On the other hand, it is difficult to make metrics that are usefully precise. As a result, many teams cannot trust their performance data.
Even with accurate and precise metrics, the data is hard to use. How do we define "fast"? How do we balance speed and consistency? How do we quickly find regressions or see the impact of optimizations?
In this post, we share how to build performance metrics for blazingly fast web apps.
1. Use the right clock
Javascript has 2 clocks: performance.now() and new Date().
What's the difference? For us, there are two:
performance.now()is significantly more precise.new Date()is precise to ±1ms, whereasperformance.now()is precise to ±100μs. (Yes, microseconds!)performance.now()is strictly monotonic. In other words, it can never go back in time. If your machine time changes,new Date()will also change — ruining your data. Butperformance.now()will just keep counting.
While performance.now() is clearly the better clock to use, it is not perfect. They both suffer from the same issue when the machine is asleep: the measurements include the time when the machine was not even active.
2. Ensure your app is in the foreground
If your user switches to another browser tab, your metrics will break. Why? Because browsers throttle the CPU for apps running in the background.
We now have two situations that will skew our metrics and make things appear to be much slower than they are:
- The machine going to sleep
- The app running in a background tab
Both of these situations are quite likely. Fortunately, we have two possible solutions.
Firstly, we could simply ignore skewed metrics by dropping outrageous numbers. Your button did not take 15 minutes to do its thing! This quick approach might be all you need.
Secondly, we could use document.hidden and the visibilitychange event . This event fires when the user switches to or from the tab, when the browser is minimized or restored, and when the machine awakes from sleep. In other words, it does exactly what we need. And while the tab is in the background, document.hidden is true.
Here's a simple implementation:
let lastVisibilityChange = 0
window.addEventListener('visibilitychange', () => {
  lastVisibilityChange = performance.now()
})

// don’t log any metrics started before the last visibility change
// or if the page is hidden

if (metric.start < lastVisibilityChange || document.hidden) return
We are discarding data, but that is a good thing. We are discarding the data from when the machine was not running our app at full speed.
While this is data we don't care about, there are plenty of other interactions we do care about. Let's see how we can measure those.
3. Find the best event start time
One of the most controversial JavaScript features is that the event loop is single-threaded. Only one piece of code can run at a time, and it cannot be interrupted.
If the user presses a key while code is running, you won't know until after the code has finished. For example, if your app spent 1000ms in a tight loop, and your user hit Escape after 100ms, you would not register it for a further 900ms!
This can really distort our metrics. If we want to accurately measure what users perceive, this is a huge problem!
Fortunately, there is an easy solution. If there is a current event, instead of using performance.now() (the time we see the event), we use window.event.timeStamp (the time the system logged the event).
The event timestamp is set by the browser's main process. Since this process is not blocked when the event loop is blocked, event.timeStamp provide a much better idea of when the event actually started.
I should note that this is still not perfect. There is still 9–15ms of unaccounted latency between the physical keypress and the event arriving in Chrome. (Pavel Fatin has an incredible article that explains why this takes time.)
However, even if we could measure the time before events reach Chrome, we shouldn't include this time in our metrics. Why? Because we cannot make code changes that significantly affect this latency. It is not actionable.
It seems that event.timeStamp is the best place to start.
Where is the best place to finish?
4. Finish in requestAnimationFrame()
The JavaScript event loop has another consequence: unrelated code can run after your code, but before the browser display updates.
Consider React. After your code runs, React updates the DOM. If you only measured time in your code, you'd miss the time in React.
To measure this extra time, we use requestAnimationFrame() to end our timer only when the browser is ready to flush the frame:
requestAnimationFrame(() => { metric.finish(performance.now()) })
As the diagram shows, requestAnimationFrame() runs after the CPU work is done, and just before the frame is rendered. If we end our timer here, we can be quite confident that we included all the time before the screen updates.
So far, so good! But now things will become rather complex…
5. Ignore layout and paint times
The frame diagram illustrates another problem. Before the frame is over, the browser has to Layout and Paint. If we don't include these, our measured time will still be less than the time for our update to appear on the screen.
Luckily, requestAnimationFrame has another trick up its sleeve. When it is called, it is passed a timestamp that is the start of the current frame (the far left of the diagram). The timestamp is usually shortly after the end of the previous frame.
We could therefore fix the shortfall by measuring the total time from event.timeStamp until the start of the next frame. Note the nested requestAnimationFrame:
requestAnimationFrame(() => {
  requestAnimationFrame((timestamp) => { metric.finish(timestamp) })
})
Although this seems like a great solution, we ended up not using it. For whilst it increases accuracy, it reduces precision. These timings can be at most as precise as the Chrome frame rate. Chrome frames run every 16ms, so the best precision is ±16ms. And if the browser is overloaded and dropping frames, the precision will be unpredictably worse than that.
If you implement this solution, major performance improvements — such as shaving 15ms off a 32ms task — can make no difference to the metrics.
By skipping Layout and Paint, we acquire significantly more precise metrics (±100μs) for the code that we can control. And every improvement will show in the numbers.
requestAnimationFrame(() => {
  setTimeout(() => { metric.finish(performance.now()) }
})
This would include rendering time, and would also not be quantized to 16ms. However, we decided not to use this approach either: if there are long input events, setTimeouts can be significantly delayed until after the UI updates.
6. Measure the "% of events that are under target"
When building for performance, we are trying to optimize two things:
- Speed. The fastest tasks should be as close as possible to 0ms.
- Consistency. The slowest tasks should be as close as possible to the fastest tasks.
Because these two variables both change over time, it is hard to visualize and reason about. Can we design a visualization that encourages us to optimize speed and consistency?
The typical approach is to measure the 90th percentile latency. This creates a line graph with milliseconds on the y-axis, and you can see that 90% of events were faster than the line.
We know that 100ms is the perceptual threshold between fast and slow.
But what does a 90th percentile latency of 103ms tell us about our user experience? Not much. What percentage of the time is our app a good experience? There's no way to know for sure.
And what does a 90th percentile latency of 93ms tell us about our user experience? It is likely a bit better than with 103ms of latency, but that's about all we can say. Again, there's no way to know for sure.
We found a solution to this problem: measure the % of events under 100ms. This approach has 3 big advantages:
- The metric is framed around the user. It can tell us what percentage of time our app is fast, and what percentage of users experience speed.
- The metric lets us re-introduce the accuracy lost from not measuring to the very end of the frame (section 5). By setting a target that is a multiple of the frame rate, metrics that are close to the target will fall into slower or faster buckets.
- The metric is easier to calculate. Simply count the number of events that are under target and divide it by the total number of events. Percentiles are much harder to calculate. There are somewhat efficient approximations, but to do it properly you need to compute every measurement.
This approach has only one downside: if you are slower than your target, it can be hard to see improvements.
7. Show multiple thresholds
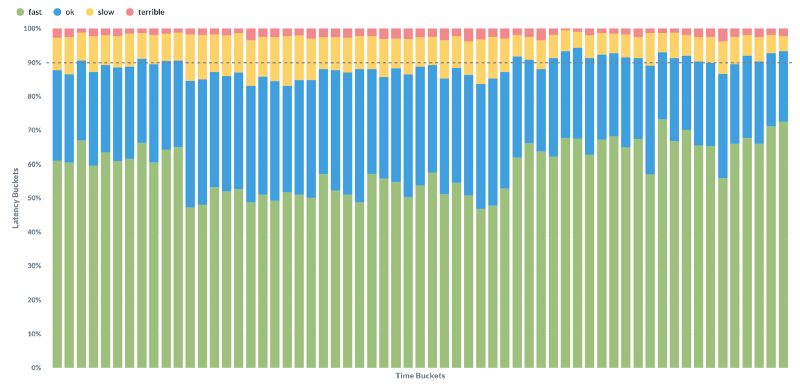
In order to visualize the impact of performance optimization, we add additional thresholds above and below 100ms. We group latencies into <50ms (fast), <100ms (ok), <1000ms (slow) and "terrible". The terrible bucket lets us see where we are severely missing the mark, which is why we color it bright red. The 50ms bucket is very sensitive to changes; performance improvements are often visible here well before the 100ms bucket.
For example, this graph visualizes the performance of viewing a thread in Superhuman:

It shows a period where performance regressed, and was later fixed. It is hard to spot the regression if you look only at the 100ms results (the top of the blue bars). It is easy to spot if you look at the 50ms results (the top of the green bars).
With a traditional approach to performance metrics, we may well have missed this issue. But because of how we measure and visualize our metrics, we were able to very rapidly find and fix the issue.
Conclusion
Performance metrics are surprisingly challenging to get right.
We found a better way to build performance metrics for web apps:
- Measure time starting at
event.timeStamp - Measure time ending at
performance.now()in arequestAnimationFrame() - Ignore anything that happened while the tab was not focused
- Aggregate data using "% of events that are under target"
- Visualize multiple thresholds
With this approach, you can create metrics that are accurate and precise. You can make graphs that quickly show regressions. You can design visualizations that quickly show the impact of optimizations. And most importantly, you can build fast software faster! ⚡️
I hope you try these metrics out in your own app. If you do, or if you have any questions, please do get in touch: @conradirwin, conrad@superhuman.com


