75+ employee productivity statistics you need to know in 2026

The latest employee productivity statistics, including remote work data, AI adoption rates, engagement trends, and insights to boost workplace performance.

Employee productivity statistics reveal a workplace at a crossroads: only 21% of employees globally are engaged, yet organizations implementing the right strategies are seeing remarkable gains. This comprehensive guide compiles the most current employee productivity statistics to help you understand what's driving performance and what's holding it back.
Below, you'll find data-backed insights on remote work, AI adoption, employee engagement, meeting overload, and more, sourced from Gallup, McKinsey, Deloitte, and other leading research organizations. Whether you're an HR leader, manager, or executive, these statistics will help you identify the biggest productivity opportunities and take action.
Top employee productivity statistics
- 83% of employees prefer a hybrid work model, according to Accenture research
- Global employee engagement sits at just 21%, costing the economy $438 billion annually in lost productivity
- 40% of U.S. employees now use AI at work, nearly doubling from 21% in 2023
- Knowledge workers spend 60% of their time on "work about work" rather than meaningful output
- Engaged employees are 18% more productive, leading to 23% higher profits
- 77% of workers experienced work-related stress in 2023
- Companies using AI-led processes show 2.5x higher revenue growth and 2.4x greater productivity
What is employee productivity?
Employee productivity measures the efficiency and output of workers relative to the time and resources invested. It encompasses both quantitative metrics (such as tasks completed, revenue generated, or units produced) and qualitative factors like work quality, innovation, and collaboration.
In knowledge-based roles, productivity often reflects an employee's ability to complete meaningful work that drives business outcomes, rather than simply logging hours. Modern productivity measurement has shifted toward evaluating outcomes and impact rather than activity tracking.
How is employee productivity measured?
Organizations measure employee productivity through several approaches:
- Output-based metrics: Tasks completed, projects delivered, sales closed, or units produced within a specific timeframe
- Time-based metrics: Time-to-completion for standard tasks, billable hours, or efficiency ratios
- Quality indicators: Error rates, customer satisfaction scores, or revision frequency
- Goal achievement: Progress toward individual, team, and organizational objectives
- Revenue per employee: Total company revenue divided by headcount
- Outcome measurement: Business impact and value created rather than activities performed
Research emphasizes that effective productivity measurement for knowledge workers should focus on outcomes rather than hours worked, given that 60% of time is currently spent on coordination rather than high-value work.
Remote and hybrid work productivity statistics
Remote and hybrid work arrangements continue to demonstrate measurable productivity advantages in 2024-2025:
- 90% of employees say their current work model (remote/hybrid) makes them as productive or more productive
- Fortune 100 Best Companies supporting remote arrangements report 42% higher productivity than typical workplaces
- Remote workers demonstrate 35-40% higher productivity than in-office employees, with 40% fewer mistakes
- A 1 percentage-point increase in remote workers correlates with a 0.08 percentage-point increase in total factor productivity growth across 61 private sector industries
- Each percentage-point increase in remote work associates with a 0.1 percentage-point decrease in unit labor costs
- $230 million was saved in fiscal 2023 through telework-related reductions in real estate and operational costs across federal agencies
- 52% of remote-capable employees now work in hybrid arrangements
- Six in 10 employees with remote-capable jobs prefer hybrid work
- Workers spending approximately two days per week in the office reported better work-life balance and higher job satisfaction
- Hybrid workers spending 2 days per week from home are 33% less likely to leave
- 60% of fully remote workers say they would look for a new job if remote flexibility is removed
- Remote work productivity increased 2% despite workdays shrinking by 36 minutes
- 98% of workers want to work remotely at least some of the time
Employee engagement and well-being statistics
Employee engagement directly impacts productivity outcomes, with current data revealing both challenges and opportunities:
- Global employee engagement sits at just 21%
- Engaged employees are 18% more productive, leading to 23% higher profits
- Disengagement costs the global economy $438 billion annually in lost productivity
- 77% of workers experienced work-related stress in 2023
- 57% of workers reported negative impacts on productivity, motivation, and physical health from stress
- U.S. employee engagement fell to 31% in 2024, the lowest level in a decade
- Mental health-related leaves increased by 33% in 2023 compared to previous years
- For every $1 invested in mental health treatment, employers see approximately $4 in return through improved health and productivity, according to WHO research
- 41% of employees globally report experiencing significant daily stress
- Highly engaged teams show 81% lower absenteeism than disengaged teams
- Companies with engaged workforces experience 43% less turnover
AI and technology adoption statistics
Technology and AI adoption are reshaping employee productivity in 2025:
- 88% of organizations now report regular AI use in at least one business function
- 40% of U.S. employees now use AI at work, nearly doubling from 21% in 2023
- Workers report generative AI time savings equivalent to 1.6% of all work hours
- Workers predict that generative AI will save them approximately 5 hours of work per week
- Companies using AI-led processes show 2.5x higher revenue growth and 2.4x greater productivity
- Only about one-third of organizations have successfully scaled AI beyond pilot phases
- 95% of generative AI pilots fail to scale profitably or generate measurable business returns
- Up to 57% of current U.S. work hours could potentially be automated with demonstrated technologies
- 72% of companies have adopted AI in at least one business function, up from 55% in 2023
- AI could contribute up to $4.4 trillion annually to the global economy
- 65% of organizations regularly use generative AI, nearly double from 2023
- Employees are 2.6x more likely to feel comfortable using AI when leadership communicates a clear integration plan
Meeting productivity statistics
Meetings represent a significant drain on workplace productivity:
- Employees lose 103 hours annually to unnecessary meetings alone
- 57% of all meetings occur without formal calendar invites
- The average employee attends 62 meetings per month
- 71% of meetings are considered unproductive by senior managers
- Meeting time has increased by 252% since February 2020
- 47% of employees consider meetings the biggest time-waster at work
- Leaders spend an average of 23 hours per week in meetings
- 92% of employees admit to multitasking during meetings
- 50% of meeting time is considered wasted by employees
Time management and distraction statistics
Interruptions and poor time management significantly impact employee productivity:
- The average worker receives 117 emails daily
- Workers experience interruptions every 2 minutes, totaling approximately 275 interruptions per workday
- Knowledge workers spend 60% of their time on "work about work" rather than productive output
- 68% of workers lack sufficient uninterrupted time to focus on important tasks
- Context switching causes a 40% loss in productivity
- It takes an average of 23 minutes for a worker to regain focus after a distraction
- Workers spend 209 hours annually on duplicative work
- Over 70% of knowledge workers keep their inbox open throughout the workday
- The average worker is only productive for 2 hours and 53 minutes in an 8-hour workday
- 89% of workers admit to wasting at least 30 minutes every workday
Email productivity statistics
Email management represents a major productivity drain for knowledge workers:
- The average professional spends 28% of their workday, approximately 2.6 hours, reading and answering emails
- Employees spend 3.1 hours per day on work email and an additional 2.5 hours on personal email
- 48% of workers report feeling chaotic or fragmented due to communication overload
- 85% of Americans report stress and fatigue from email
- 40% of workers check email as early as 6 a.m.
- 29% of workers are still active with email at 10 p.m.
- Research suggests potential productivity increases of 20-25% through email and collaboration optimization
- The average office worker receives 117-121 emails per day
- 62% of emails received are not important
- Workers with email access switch windows an average of 37 times per hour, compared to 18 times for those without
- It takes 64 seconds to recover from checking email before returning to work at the same rate
Productivity by company size statistics
Employee productivity and engagement vary based on organizational size:
- Employee engagement is highest (33%) at companies with fewer than 50 workers, compared to 22% at companies with 1,000 to 5,000 employees
- Companies with 5,000+ employees lose an estimated $101 million annually to unnecessary meetings and coordination
- Over 90% of Fortune 500 companies have integrated AI into their operations, compared to approximately 34% of small and mid-sized businesses
- Micro, small, and medium enterprises are, on average, half as productive as large companies, though this varies significantly by sector
Industry-specific productivity statistics
Productivity metrics differ substantially across industries:
- Healthcare: 49% of physicians reported feeling burned out in 2023, according to Medscape's Physician Burnout & Depression Report
- Manufacturing: Manufacturing productivity grew 2.5% in Q2 2025, with durable manufacturing up 3.2%
- Financial services: 84% of finance leaders personally use generative AI, with 77% doing so within a company-approved environment
- Retail: The retail trade sector has an annual turnover rate consistently around 60%, with some subsectors reaching as high as 81%
- Construction: 48% of all rework in U.S. construction is caused by poor data and miscommunication, representing over $31 billion in avoidable costs annually
- Education: Teachers spend 50% of their time on non-instructional tasks
Four-day workweek productivity statistics
The four-day workweek movement shows promising productivity results:
- 92% of participating companies retained the four-day workweek after a six-month trial in the UK's largest study
- Revenue increased by 35% on average during four-day workweek trials compared to the same period in previous years
- 71% of employees reported reduced levels of burnout during four-day workweek trials
- 39% of employees reported being less stressed at the end of trials
- Employee turnover dropped by 57% in organizations that implemented a four-day workweek
Generational productivity statistics
Different generations demonstrate distinct approaches to workplace productivity:
- 70% of Gen Z professionals develop skills to advance their careers at least once a week, compared to 59% of millennials
- Only 6% of Gen Z say their primary career goal is to reach a leadership position
- 44% of Gen Z have left a role they felt lacked purpose, with around 40% having rejected an assignment or potential employer based on their values
- 40% of Gen Z workers feel stressed all or most of the time, compared to 35% of millennials
Skills gap and training statistics
The skills gap presents both challenges and opportunities for productivity:
- 39% of workers' core skills are expected to change by 2030
- Skills for jobs have changed by around 25% since 2015 and are expected to double by 2027
- The global skills gap is expected to cost $8.5 trillion by 2030, with the U.S. potentially losing $1.7 trillion in unrealized revenue
- 87% of companies worldwide are aware they already have or will have a skills gap within a few years
- Nearly 9 in 10 organizations report that upskilling is more cost-effective than hiring new talent
- 94% of employees would stay longer at a company that invests in their learning
- Companies that invest in training see 24% higher profit margins than those that don't
Economic productivity statistics
Broader economic productivity trends reveal the current landscape:
- U.S. nonfarm business productivity increased 2.3% in 2024
- U.S. nonfarm business sector Q2 2025 showed +3.3% quarterly productivity growth
- Manufacturing productivity increased 2.5% in Q2 2025
- Global labor productivity (GDP per hour worked) shows +1.6% in 2023, with forecasts of +2.5% for 2025
- While 73% of organizations conduct operational workforce planning, only 12% engage in strategic workforce planning with a 3+ year horizon
- U.S. output per hour has grown 1.5% annually on average since 2019
- Labor productivity in the EU grew 0.4% in 2024, significantly trailing U.S. growth
How to improve employee productivity
Based on the employee productivity statistics above, here are evidence-based strategies for boosting workplace performance:
Implement flexible work arrangements
The data is clear: flexibility drives productivity. Stanford research found hybrid workers perform just as well as in-office peers while being 33% less likely to leave, making work location flexibility essential.
Action steps:
- Establish a hybrid policy allowing 2-3 days of remote work weekly
- Provide home office stipends for equipment and ergonomics
- Create clear communication protocols for distributed teams
- Measure outcomes rather than hours logged
- Survey employees quarterly on flexibility preferences
Address engagement and burnout proactively
With only 21% global engagement and 77% of workers experiencing stress, wellbeing investments deliver proven returns.
Action steps:
- Implement mental health programs (WHO research shows $4 return per $1 invested)
- Train managers to recognize burnout warning signs
- Establish regular check-ins focused on wellbeing, not just tasks
- Offer mental health days and encourage their use
- Create peer support programs and mentorship opportunities
Leverage AI and automation strategically
With 40% of employees now using AI and potential time savings of 5 hours weekly, technology adoption is critical—but only one-third of organizations have scaled successfully.
Action steps:
- Identify repetitive tasks that can be automated first
- Start with pilot programs before full-scale rollout
- Invest in comprehensive training for higher success rates
- Measure time saved and productivity gained quarterly
- Create feedback loops for continuous improvement
- Explore AI email management tools to reduce inbox time
Protect focus time ruthlessly
The 275 daily interruptions workers face and 40% productivity loss from context switching demand systematic intervention.
Action steps:
- Establish company-wide "no meeting" blocks (minimum 3 hours daily)
- Implement meeting-free days at least once per week
- Require agendas and clear objectives for all meetings
- Set communication response time expectations (not everything needs instant replies)
- Create quiet zones or focus rooms in office spaces
Reduce meeting overload
With employees losing 103 hours annually to unnecessary meetings and 71% of meetings considered unproductive, meeting culture needs an overhaul.
Action steps:
- Audit all recurring meetings quarterly and eliminate low-value ones
- Default to 25-minute or 50-minute meetings instead of 30/60
- Require a written agenda 24 hours before any meeting
- Limit attendees to essential participants only
- Use asynchronous updates (video messages, written briefs) when possible
Invest in skills development
With 39% of skills changing by 2030 and 94% of employees willing to stay longer for learning opportunities, development programs are productivity multipliers.
Action steps:
- Allocate dedicated learning time (minimum 2 hours weekly)
- Create personalized development plans for each employee
- Offer cross-training and job rotation opportunities
- Provide access to online learning platforms
- Tie skill development to career progression paths
Optimize email and communication workflows
Reducing the 2.6 hours daily spent on email and addressing the 85% of Americans who report stress and fatigue from email can yield significant productivity improvements.
Action steps:
- Implement email management tools with AI prioritization
- Set expectations for response times by message type
- Batch email processing into 2-3 dedicated windows daily
- Use subject line conventions to indicate urgency and action needed
- Train teams on Inbox Zero principles to maintain clean, manageable inboxes
- Learn how to organize email for maximum efficiency
For executives managing high volumes of correspondence, executive email management strategies can help reclaim hours each week. Teams can also benefit from email collaboration tools that streamline communication.
Boost productivity with better email management
These employee productivity statistics reveal significant challenges, from 21% global engagement to 275 daily interruptions, but the solutions are clear. Remote and hybrid work, strategic AI adoption, and protected focus time consistently drive measurable gains.
Email and communication overload represent the largest untapped productivity opportunity. With workers spending 2.6 hours daily on email and 60% of their time on coordination, addressing this friction delivers immediate returns.
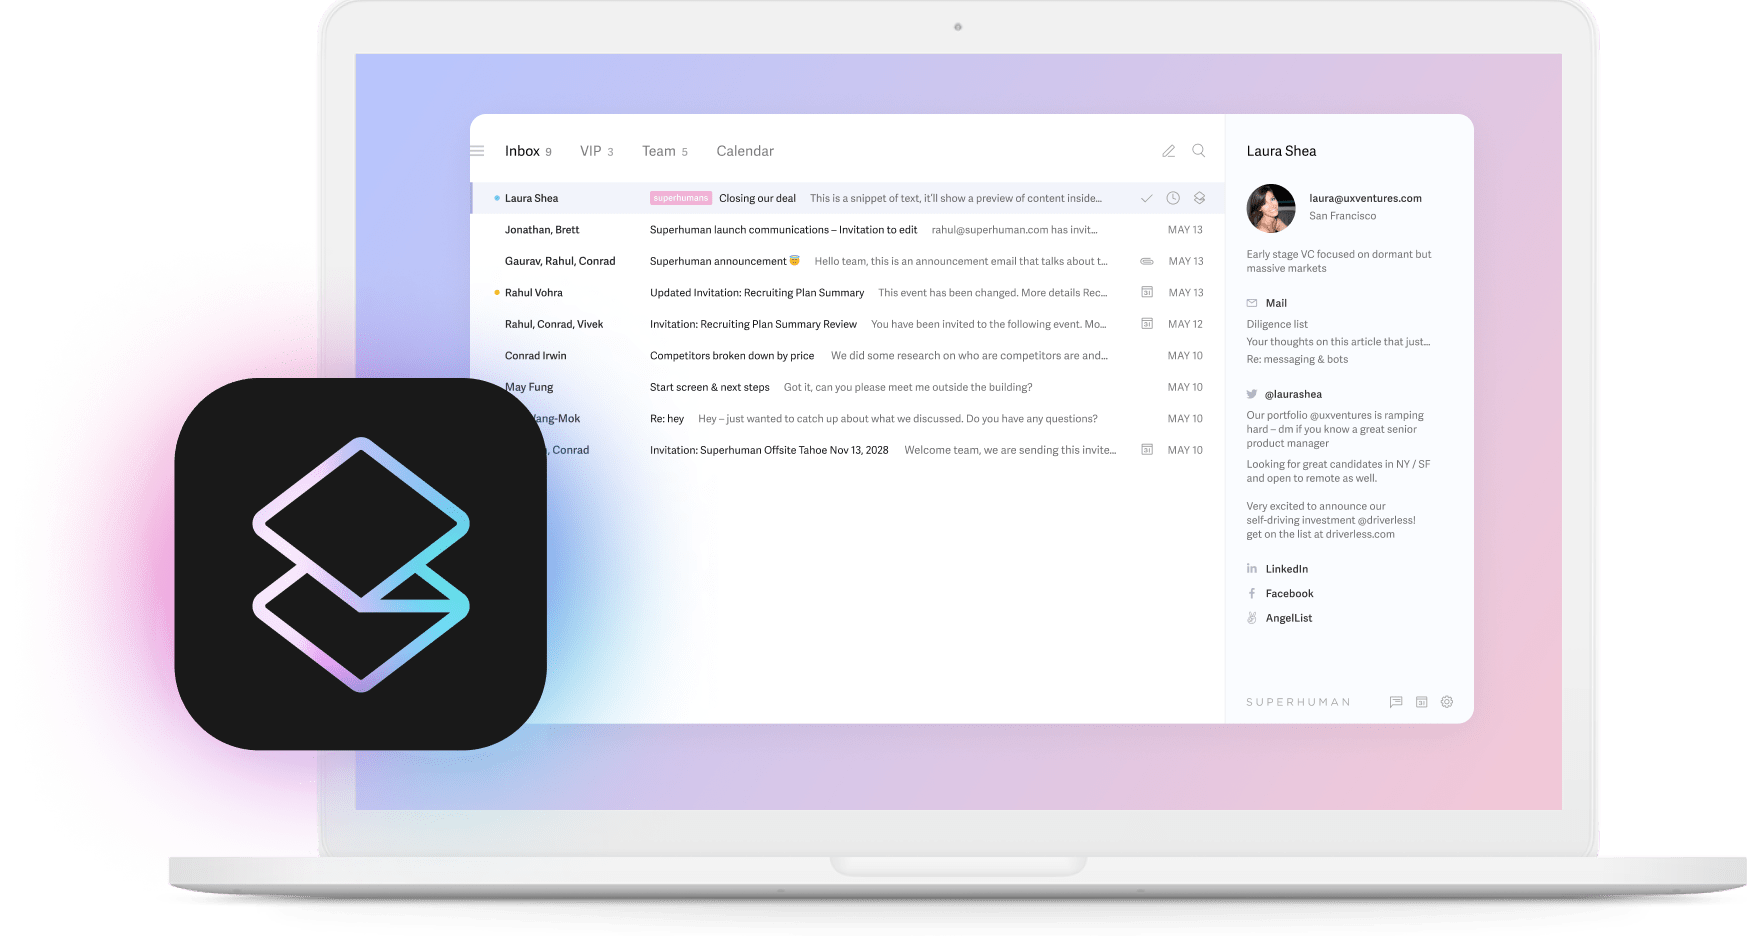
Superhuman Mail tackles these challenges directly, helping teams save 4 hours per person weekly, respond 12 hours faster, and handle twice as many emails. AI-powered message prioritization helps employees focus on what matters, instant reply capabilities reduce drafting time, and keyboard shortcuts eliminate friction. For organizations looking to improve their employee productivity statistics, optimizing email workflow is one of the fastest paths to results.